
Abstract
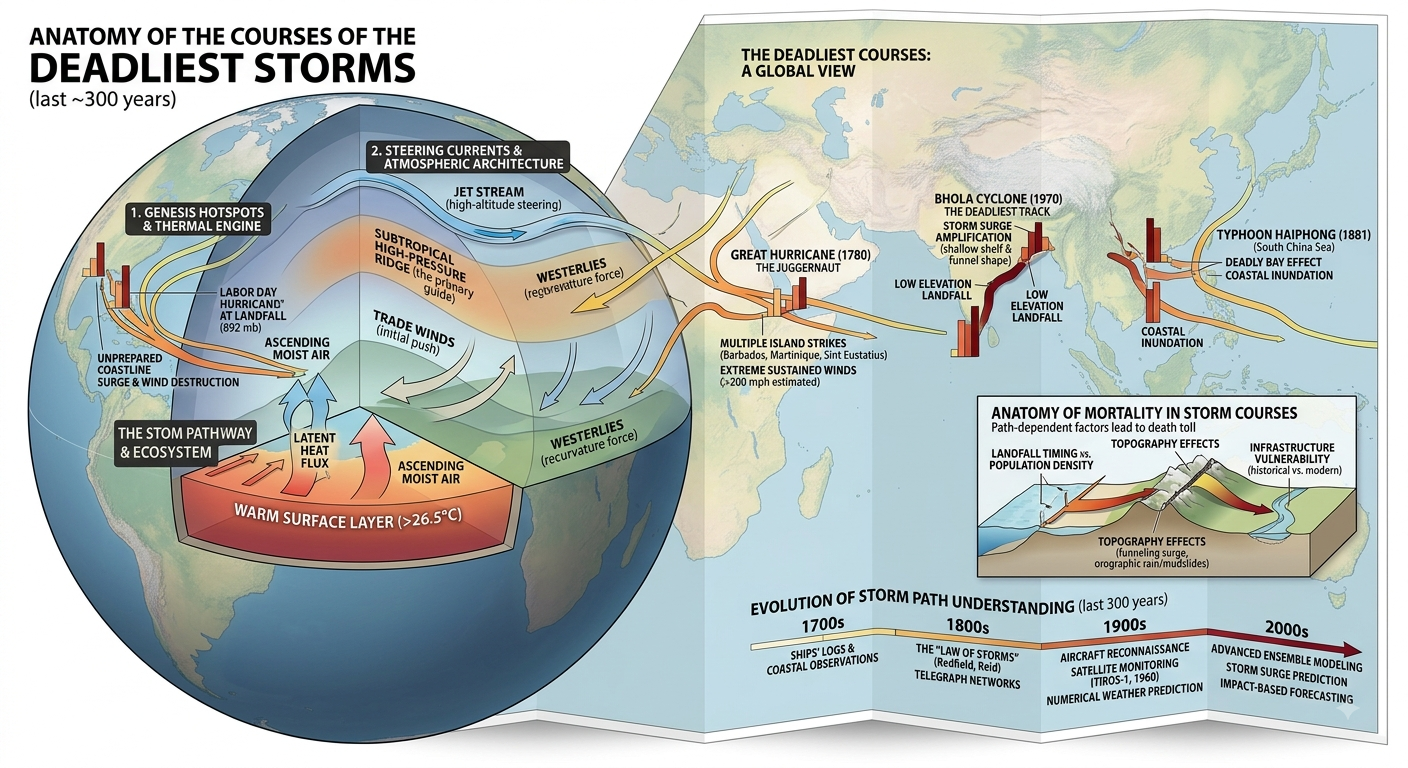
Tropical cyclones are among Earth’s most powerful natural systems. They are simultaneously atmospheric engines, ocean–atmosphere heat exchangers, rotating fluid systems, sources of extreme rainfall, generators of destructive waves and storm surges, and major agents of social and economic disruption. Their trajectories—or courses—are determined by the interaction of atmospheric circulation, ocean temperature, planetary rotation, pressure gradients, steering winds, land interaction and changing environmental conditions.
This thesis examines approximately three centuries of catastrophic storms, from the early historical record to 2026, with particular attention to the storms that produced exceptionally high mortality, destructive storm surge, extreme rainfall, major economic losses, remarkable trajectories or exceptional longevity.
A fundamental methodological problem immediately appears: there is no homogeneous 300-year global database of tropical-cyclone tracks. Modern global best-track archives extend principally into the nineteenth century, while reliable satellite-era observations begin only in the twentieth century. NOAA’s IBTrACS database is the most comprehensive global collection of tropical-cyclone observations, but even it documents substantial uncertainty in older records. NOAA notes that nineteenth-century observations depended heavily on ships and storms affecting populated land, whereas modern satellites detect virtually every tropical cyclone.
Consequently, the historical portion of this thesis combines documentary evidence, historical reconstructions and modern best-track science rather than pretending that an eighteenth-century storm can be mapped with the precision of a twenty-first-century satellite-observed cyclone.
The central conclusion is that storm mortality is not determined by atmospheric intensity alone. Disaster risk emerges from the interaction:
Hazard × Exposure × Vulnerability = Disaster Risk
The 1970 Bhola cyclone illustrates this principle dramatically. WMO identifies Bhola as the world’s deadliest tropical cyclone, with an estimated death toll around 300,000, while its enormous mortality was strongly associated with storm surge striking densely populated, low-lying coastal areas.
At the other end of the technological spectrum, Cyclone Freddy demonstrates how modern observation can reveal extraordinary behaviour that would have been difficult to document in earlier centuries. WMO certified Freddy in 2024 as the longest-lasting tropical cyclone on record at 36 days, travelling approximately 12,785 km while maintaining tropical-storm status or higher.
The history of deadly storms is therefore also a history of human technological development—from ship logs and coastal observations to telegraph networks, weather stations, aircraft reconnaissance, radar, satellites, numerical weather prediction, ocean observing systems, GIS, supercomputing and artificial intelligence.
1. Introduction: What Is the “Course” of a Storm?
A tropical cyclone’s course is its changing geographical position through time.
Meteorologists normally represent this course as a sequence of latitude–longitude positions connected into a track.
A simplified track can be represented mathematically as:
[
T(t)=[\phi(t),\lambda(t)]
]
where:
- (\phi(t)) = latitude at time (t)
- (\lambda(t)) = longitude at time (t)
- (T(t)) = geographical position of the cyclone.
But the track is only the visible expression of a much more complicated physical system.
At every point along its journey, the cyclone is simultaneously interacting with:
- the ocean;
- atmospheric pressure fields;
- temperature gradients;
- humidity;
- vertical wind shear;
- planetary rotation;
- surrounding weather systems;
- land surfaces;
- mountains;
- coastlines;
- upper-atmospheric steering currents.
The course of a cyclone can therefore be regarded as the macroscopic trajectory produced by an enormous coupled fluid-dynamic system.
2. Terminology: Hurricane, Typhoon and Cyclone
The underlying phenomenon is essentially the same.
Different regions use different terminology:
| Region | Common terminology |
|---|---|
| Atlantic | Hurricane |
| Northeast Pacific | Hurricane |
| Northwest Pacific | Typhoon |
| North Indian Ocean | Cyclone |
| South Indian Ocean | Tropical cyclone |
| South Pacific | Tropical cyclone |
The generic scientific term is tropical cyclone.
The word “cyclone” describes the rotating atmospheric circulation rather than necessarily implying a particular intensity.
3. The Physical Anatomy of a Tropical Cyclone
A mature tropical cyclone contains several principal structures.
3.1 Eye
The eye is the relatively calm central region.
It can have:
- relatively weak winds;
- lower cloud cover;
- comparatively low pressure;
- subsiding air.
The eye is surrounded by the eyewall.
3.2 Eyewall
The eyewall contains some of the cyclone’s strongest winds and most intense convection.
It is frequently the region of greatest wind destruction.
3.3 Spiral rainbands
Outside the eyewall are curved bands of thunderstorms.
These bands can generate:
- torrential rainfall;
- strong winds;
- lightning;
- tornadoes in some environments;
- localized flooding.
3.4 Central pressure
A mature cyclone generally possesses a very low central pressure.
The pressure gradient between the cyclone and surrounding atmosphere contributes to strong winds.
3.5 Wind field
A cyclone is not simply a single point of maximum wind.
Its destructive footprint depends upon:
- maximum wind speed;
- radius of damaging winds;
- storm size;
- forward motion;
- terrain;
- interaction with other weather systems.
4. How a Tropical Cyclone Is Born
Most tropical cyclones originate over sufficiently warm tropical or subtropical oceans.
The simplified sequence is:
Warm ocean → evaporation → moist air → convection → latent-heat release → pressure reduction → circulation → organization → intensification
The ocean supplies heat and moisture.
Water evaporates from the surface and enters the atmosphere as water vapour.
When moist air rises and condenses into clouds, latent heat is released.
That heat warms the surrounding air, encouraging further ascent.
The resulting pressure changes can strengthen the circulation.
5. The Coriolis Effect
Earth’s rotation is essential to the large-scale organization of tropical cyclones.
The Coriolis effect causes moving air to be deflected:
- to the right in the Northern Hemisphere;
- to the left in the Southern Hemisphere.
Consequently:
- Northern Hemisphere tropical cyclones rotate counterclockwise;
- Southern Hemisphere tropical cyclones rotate clockwise.
This is one reason tropical cyclones generally do not form immediately at the equator, where the Coriolis parameter becomes very small.
6. Why Storms Move
A cyclone does not normally steer itself like a vehicle.
Its movement is strongly influenced by the larger atmospheric circulation surrounding it.
This is commonly called environmental steering.
Important steering mechanisms include:
- subtropical ridges;
- mid-latitude troughs;
- upper-level winds;
- pressure systems;
- interaction with other cyclones;
- changes in atmospheric circulation.
A simplified conceptual model is:
[
\vec{V}{storm}\approx f(\vec{V}{environment})
]
The storm’s motion is therefore closely related to the surrounding environmental wind field.
7. Genesis Regions and the Great Global Storm Corridors
The major tropical-cyclone-producing regions include:
- North Atlantic
- Northeast Pacific
- Northwest Pacific
- North Indian Ocean
- South Indian Ocean
- South Pacific
- Australian region
These regions are not equally dangerous.
Risk depends on the combination of:
[
Risk = Hazard \times Exposure \times Vulnerability
]
A powerful storm travelling over open ocean can cause comparatively little human loss.
A weaker storm crossing a densely populated, poorly protected delta can cause enormous mortality.
8. The Historical Record: Why 300 Years Cannot Be Treated as One Dataset
This is one of the most important scientific limitations of the thesis.
Modern tropical-cyclone databases do not contain equally accurate observations for every year since 1726.
NOAA explains that global historical track data become increasingly sparse as researchers move backwards in time. Nineteenth-century mariners recorded cyclone positions in ship logs, and many storms escaped observation unless they affected land or shipping routes. Modern satellite systems have transformed this situation because storms can now be monitored across virtually the entire planet.
NOAA’s IBTrACS archive combines tropical-cyclone information from numerous international agencies and is currently the most comprehensive global best-track collection. It provides position and intensity information and is available in formats including CSV, NetCDF and shapefiles.
Therefore:
Historical confidence
1726–1840: extremely incomplete
1840s–early 1900s: improving but geographically uneven
early–mid twentieth century: substantially improved
aircraft/radar era: much better
satellite era: global monitoring revolution
1980s–2026: highly instrumented modern observational era
This means apparent increases in storm frequency in historical databases can partly represent better detection, rather than a simple physical increase in storms.
9. Eighteenth and Early Nineteenth Centuries
The early historical period contains numerous devastating storms whose exact tracks cannot be reconstructed with modern precision.
Sources include:
- ship logs;
- colonial administrative records;
- newspapers;
- church records;
- port records;
- diaries;
- military reports;
- agricultural records;
- historical flood descriptions.
The Atlantic record demonstrates how valuable documentary history can be. NOAA’s historical catalogue contains hundreds of Atlantic cyclones associated with fatalities and includes storms dating back to the fifteenth century.
The famous Great Hurricane of 1780, for example, is generally regarded as one of the deadliest Atlantic hurricanes in recorded history, with estimates exceeding 20,000 deaths. NOAA’s historical Atlantic catalogue lists more than 22,000 deaths in some historical estimates.
However, historical death estimates must be treated as ranges rather than exact measurements.
10. The Great Hurricane of 1780
The Great Hurricane of 1780 affected several Caribbean islands during October 1780.
Its historical significance is enormous because:
- communications were primitive;
- weather forecasting did not exist in its modern form;
- coastal populations had limited warning;
- ships could not receive modern forecasts;
- storm surge and wind devastated communities;
- military forces were also heavily affected.
The event demonstrates a fundamental principle:
A storm becomes a catastrophe when environmental hazard intersects human exposure and limited adaptive capacity.
The storm belongs to a period when humanity had little ability to observe or predict atmospheric systems at continental and oceanic scales.
11. The Nineteenth-Century Observation Revolution
During the nineteenth century, humanity gradually developed:
- standardized meteorological observations;
- barometers;
- thermometers;
- improved marine navigation;
- telegraph communications;
- weather stations;
- international data exchange.
The telegraph was particularly important.
Before rapid communication, a storm could be observed only locally.
With telegraphic networks, observations could be transmitted rapidly over large distances.
Meteorology consequently evolved from local weather description into a form of distributed planetary observation.
12. The 1900 Galveston Hurricane
The Galveston hurricane of September 1900 remains one of the deadliest natural disasters in United States history.
NOAA’s historical Atlantic cyclone catalogue gives an estimated death toll around 12,000, with historical estimates varying substantially.
The catastrophe demonstrates the importance of:
- coastal topography;
- storm surge;
- population exposure;
- inadequate warning;
- communication limitations;
- structural vulnerability.
Galveston was not destroyed merely by wind.
The storm surge was a major component of the disaster.
This distinction is essential when analysing storm anatomy.
13. The Storm Surge Problem
Storm surge is an abnormal rise in coastal water level generated primarily by a storm’s winds and pressure effects.
It can be conceptualized as:
[
Coastal\ Water\ Level =
Astronomical\ Tide + Storm\ Surge + Waves
]
The resulting water level can become catastrophic when a storm arrives during high tide or interacts with vulnerable coastal geometry.
Particularly vulnerable environments include:
- river deltas;
- shallow continental shelves;
- low islands;
- coastal wetlands;
- densely populated estuaries.
14. The Bay of Bengal: A Global Centre of Cyclone Mortality
The Bay of Bengal has repeatedly experienced catastrophic tropical-cyclone disasters.
Its vulnerability results from several interacting factors:
- enormous population density;
- low-lying coastal terrain;
- river deltas;
- shallow coastal waters;
- storm-surge amplification;
- historical poverty;
- settlements close to water;
- limited historical warning capacity.
This makes Bangladesh one of the most important locations for understanding the relationship between cyclone physics and human vulnerability.
15. The 1970 Bhola Cyclone
The Bhola cyclone of November 1970 is the defining event in the history of tropical-cyclone mortality.
WMO identifies it as the deadliest tropical cyclone on record, with an estimated death toll around 300,000, although historical estimates have ranged higher.
Its destruction resulted primarily from the enormous storm surge that swept across low-lying coastal areas.
This storm demonstrates why:
[
Maximum\ Wind \neq Maximum\ Mortality
]
A cyclone’s death toll depends on the complete hazard system.
16. Bhola as a Turning Point in Disaster Science
The Bhola catastrophe contributed to major institutional changes in cyclone preparedness.
WMO notes that the disaster helped stimulate regional cooperation and contributed to the development of coordinated cyclone disaster-risk-reduction mechanisms.
The technological response eventually included:
- satellite surveillance;
- radar;
- weather stations;
- cyclone shelters;
- evacuation planning;
- community warning systems;
- improved forecasting;
- regional meteorological cooperation.
Thus Bhola became not only a tragedy but also a major lesson in risk engineering.
17. The 1991 Bangladesh Cyclone
The April 1991 cyclone in Bangladesh produced catastrophic mortality.
WMO’s mortality atlas places the death toll at approximately 138,866, making it one of the deadliest tropical cyclones in modern historical records.
The event demonstrates that improved forecasting alone is insufficient.
Forecasts must be converted into:
Observation → Forecast → Warning → Communication → Trust → Evacuation → Survival
The final link is human action.
18. Cyclone Nargis, 2008
Cyclone Nargis struck Myanmar in May 2008.
WMO’s mortality database estimates approximately 138,366 deaths, placing Nargis among the deadliest tropical cyclones in the modern record.
Nargis demonstrated the devastating interaction between:
- cyclone winds;
- storm surge;
- low-lying delta terrain;
- flooding;
- population exposure;
- vulnerability;
- limitations in disaster preparedness.
The Irrawaddy Delta was particularly vulnerable because enormous numbers of people lived in low-lying environments exposed to coastal flooding.
19. Hurricane Mitch, 1998
Hurricane Mitch became one of the most destructive storms in Central American history.
Its significance was not simply the intensity of the cyclone.
A critical component was prolonged heavy rainfall.
Rain falling over mountainous terrain produced:
- flash floods;
- river flooding;
- landslides;
- destruction of roads;
- destruction of bridges;
- agricultural losses;
- isolation of communities.
This illustrates an important principle:
A tropical cyclone can remain deadly long after its centre has ceased to be a hurricane.
20. Hurricane Katrina, 2005
Katrina is one of the most important examples of a technologically advanced society experiencing catastrophic failure during a major cyclone.
The storm affected the Gulf Coast and produced catastrophic flooding in the New Orleans region.
WMO records more than 1,800 deaths associated with Katrina.
Its importance extends beyond meteorology.
Katrina became a major case study in:
- infrastructure vulnerability;
- levee systems;
- emergency management;
- evacuation;
- social inequality;
- urban resilience;
- interdependent infrastructure.
It also demonstrates why economic damage and mortality must be analysed separately.
21. Typhoon Haiyan, 2013
Typhoon Haiyan struck the Philippines in November 2013.
WMO’s mortality atlas records approximately 7,354 deaths.
Haiyan demonstrated the importance of:
- extreme wind;
- storm surge;
- coastal exposure;
- rapid intensification;
- densely populated coastal settlements.
Its extraordinary intensity also demonstrated the importance of high-resolution satellite observations and modern numerical prediction.
22. Cyclone Idai, 2019
Cyclone Idai is particularly important to African disaster science.
The storm affected Mozambique and neighbouring countries in southeastern Africa.
WMO reports that Idai struck central Mozambique with winds reaching approximately 195 km/h, causing catastrophic flooding and more than 600 deaths, with estimated economic damage around US$3 billion.
Idai demonstrated that the geographical impact of a tropical cyclone can extend far inland.
The disaster involved not simply wind but:
Cyclone + rainfall + rivers + saturated land + floodplain settlements + infrastructure vulnerability.
23. Cyclone Freddy, 2023
Freddy is one of the most scientifically remarkable tropical cyclones of the modern observational era.
WMO subsequently certified Freddy as the world’s longest-lasting tropical cyclone at 36 days.
It travelled approximately:
[
12,785\ km
]
while maintaining tropical-storm status or greater.
Freddy crossed the South Indian Ocean from the vicinity of Australia toward southeastern Africa and affected Madagascar, Mozambique and Malawi.
Its exceptional trajectory demonstrates that cyclone longevity depends upon a complex combination of:
- ocean heat;
- atmospheric moisture;
- favourable environmental conditions;
- steering currents;
- repeated weakening and re-intensification;
- interactions with land and ocean.
24. Freddy and Southern Africa
Freddy is especially significant for Africa.
WMO reports that the cyclone affected Madagascar and Mozambique and subsequently caused major impacts in southern Africa.
Its interaction with Mozambique illustrates another important phenomenon:
A cyclone’s destructive life does not necessarily end at landfall.
A storm can continue producing:
- torrential rain;
- river flooding;
- landslides;
- infrastructure damage;
- disease risks;
- agricultural destruction.
25. Why Freddy Is Technologically Important
Freddy could be tracked continuously because the modern world possesses:
- geostationary satellites;
- polar-orbiting satellites;
- numerical models;
- ocean observations;
- aircraft and surface observations;
- radar;
- automated weather stations;
- high-speed communications.
WMO’s certification was possible because scientists could reconstruct the cyclone’s entire life cycle using multiple observational systems.
An eighteenth-century storm might have produced equally extraordinary behaviour without leaving sufficient observations for scientists to know it.
26. A Comparative Catalogue of Major Deadly Storms
WMO’s mortality data for 1970–2019 provide an especially useful modern comparison.
| Storm/event | Year | Principal affected area | Approx. deaths |
|---|---|---|---|
| Bhola | 1970 | Bangladesh | 300,000 |
| Gorky / April Bangladesh cyclone | 1991 | Bangladesh | 138,866 |
| Nargis | 2008 | Myanmar | 138,366 |
| Bangladesh cyclone | 1985 | Bangladesh | 15,000 |
| Mitch | 1998 | Honduras/Central America | 14,600 |
| India cyclone | 1977 | India | 14,204 |
| India cyclone | 1999 | India | 9,843 |
| India cyclone | 1971 | India | 9,658 |
| Fifi | 1974 | Honduras | 8,000 |
| Haiyan | 2013 | Philippines | 7,354 |
These figures should not be interpreted as perfectly comparable because historical casualty estimation methods differ between countries and events.
27. The Atlantic Historical Record
The Atlantic record demonstrates how deadly storms existed long before modern meteorological technology.
NOAA’s historical catalogue includes storms associated with thousands of fatalities and documents the difficulties of reconstructing early events from newspapers, shipwreck reports, historical documents and other sources.
Examples include:
- Great Hurricane of 1780;
- Pointe-à-Pitre Bay cyclone of 1776;
- Newfoundland Banks cyclone of 1775;
- Galveston hurricane of 1900;
- Dominican Republic cyclone of 1930;
- Flora of 1963;
- Fifi of 1974.
The historical record therefore reveals that deadly cyclones are not a modern phenomenon.
What has changed is our ability to see, measure, model and respond to them.
28. From Ship Logs to Satellites
The technological history of storm tracking can be divided into several stages.
Stage 1 — Human observation
Pre-1800
Observations came from:
- sailors;
- fishermen;
- coastal populations;
- military observers;
- local officials.
Stage 2 — Instrumentation
1800s
Development of:
- barometers;
- thermometers;
- standardized observations.
Stage 3 — Telegraph
Rapid communication permitted observations to travel beyond the location where they were collected.
Stage 4 — Radio
Ships and remote stations could communicate weather observations.
Stage 5 — Aircraft
Aircraft could investigate cyclone structure directly.
Stage 6 — Radar
Radar allowed forecasters to observe precipitation and storm structure near land.
Stage 7 — Satellites
Global monitoring became possible.
Stage 8 — Numerical weather prediction
Supercomputers began solving mathematical approximations of atmospheric behaviour.
Stage 9 — Modern data assimilation
Satellite, aircraft, radar, buoy and surface observations can be integrated into computational forecasting systems.
Stage 10 — Artificial intelligence
Machine-learning methods are increasingly being investigated for forecasting, pattern recognition, data assimilation and rapid prediction.
29. The Satellite Revolution
Satellite meteorology transformed tropical-cyclone science.
A cyclone travelling across an empty ocean no longer has to remain invisible.
Modern satellites can provide information about:
- cloud structure;
- atmospheric moisture;
- sea-surface conditions;
- storm organization;
- wind fields;
- temperature;
- precipitation;
- atmospheric motion.
This creates an enormous difference between historical and modern storm records.
30. IBTrACS: The Global Digital Storm Archive
NOAA’s International Best Track Archive for Climate Stewardship, or IBTrACS, merges cyclone information from international meteorological agencies.
It contains information including:
- position;
- intensity;
- central pressure;
- storm classification;
- basin;
- time;
- additional parameters from contributing agencies.
The dataset is available globally and provides standardized formats suitable for computational analysis.
IBTrACS is therefore effectively part of the digital infrastructure of modern cyclone science.
31. Geographic Information Systems
GIS technology allows researchers to overlay storm tracks with:
- population;
- roads;
- hospitals;
- schools;
- elevation;
- coastlines;
- rivers;
- buildings;
- electricity infrastructure;
- agricultural land.
This changes the fundamental question.
Instead of asking:
“Where did the cyclone go?”
scientists can ask:
“What did the cyclone encounter along its course?”
That is the beginning of modern impact forecasting.
32. Numerical Weather Prediction
Modern atmospheric models divide the atmosphere into computational cells.
The governing equations include approximations of:
- conservation of momentum;
- conservation of mass;
- thermodynamics;
- moisture;
- radiation;
- cloud processes;
- surface exchange.
The computational system can be conceptualized as:
[
State(t+\Delta t)=Model[State(t),Boundary\ Conditions]
]
The computer repeatedly advances the atmospheric state forward in time.
33. Why Forecasting a Track Is Difficult
Small errors in atmospheric conditions can produce large differences in predicted cyclone positions several days later.
This is partly a consequence of the chaotic nature of the atmosphere.
Therefore, modern forecasting increasingly uses ensembles.
Instead of calculating one future:
[
Forecast = F_1
]
meteorologists calculate many plausible futures:
[
F_1,F_2,F_3,\ldots,F_n
]
The collection provides information about uncertainty.
34. Track Forecasting Versus Intensity Forecasting
These are separate scientific problems.
Track forecasting
Where will the cyclone go?
Intensity forecasting
How strong will it become?
A forecast can correctly predict landfall while substantially underestimating intensity.
Conversely, a model may correctly predict rapid intensification but make a significant track error.
Modern forecasting therefore treats:
position + intensity + timing + size + hazards
as related but distinct prediction problems.
35. Rapid Intensification
One of the most challenging forecasting problems is rapid intensification.
A cyclone may strengthen dramatically over a relatively short period when environmental conditions are favourable.
Important factors include:
- warm ocean water;
- high ocean heat content;
- sufficient moisture;
- low vertical wind shear;
- favourable upper-level outflow;
- organized inner-core convection.
This creates a dangerous situation because the storm can become substantially stronger before coastal populations have adequate time to respond.
36. Storm Size Matters
Maximum wind speed alone is insufficient.
Two cyclones can have identical maximum winds but dramatically different wind fields.
A large storm may affect:
- hundreds of kilometres of coastline;
- large ocean areas;
- many communities.
Therefore, modern cyclone analysis considers:
[
Hazard = f(Intensity, Size, Duration, Translation, Surge, Rainfall)
]
37. Translation Speed
A cyclone’s forward speed is another critical variable.
A slow-moving cyclone can remain over a region for a prolonged period.
That increases the potential for:
- rainfall accumulation;
- flooding;
- river discharge;
- prolonged winds;
- infrastructure stress.
A rapidly moving cyclone can produce a shorter period of direct impact but may still produce severe damage.
Thus:
[
Rainfall\ Risk \propto Intensity \times Moisture \times Residence\ Time
]
as a simplified conceptual relationship.
38. Storm Surge Versus Rainfall
The deadliest component differs between storms.
Coastal cyclone
Storm surge may dominate.
Mountainous region
Rainfall and landslides may dominate.
Urban area
Flooding plus infrastructure failure may dominate.
Island environment
Wind, waves and surge may dominate.
Therefore, there is no universal “deadliest storm mechanism.”
39. The Anatomy of Disaster
A tropical cyclone becomes a human disaster through several linked stages:
Atmospheric disturbance
↓
Cyclone formation
↓
Intensification
↓
Track toward populated region
↓
Coastal exposure
↓
Storm surge / wind / rainfall
↓
Infrastructure failure
↓
Human displacement
↓
Secondary hazards
↓
Mortality and economic loss
This is why disaster science must extend beyond meteorology.
40. The Risk Equation
A useful conceptual framework is:
[
R = H \times E \times V
]
where:
- (R) = disaster risk;
- (H) = hazard;
- (E) = exposure;
- (V) = vulnerability.
This explains why the same meteorological storm can produce completely different consequences in two countries.
41. The Bangladesh Lesson
Bangladesh provides one of the strongest examples of the value of disaster-risk reduction.
The historical sequence is striking:
1970 Bhola → enormous mortality
↓
institutional reform
↓
cyclone shelters
↓
early-warning systems
↓
community preparedness
↓
mass evacuation
↓
dramatically lower mortality in later major storms
WMO describes Bangladesh’s disaster-risk-reduction experience as an important example of effective adaptation.
This is one of the most important findings of the entire thesis:
Technology becomes lifesaving only when it reaches people and changes behaviour before the hazard arrives.
42. Mozambique and the African Lesson
Mozambique provides a comparable modern African case.
Following Cyclone Idai in 2019, Mozambique strengthened early-warning capabilities.
WMO reports that by the time Cyclone Freddy affected Mozambique in 2023, improved preparedness and evacuation contributed to substantially lower mortality than during Idai, despite Freddy’s extraordinary longevity and repeated impacts.
This demonstrates that disaster technology is not merely about predicting storms.
It is about building a complete chain:
Detection → Prediction → Communication → Preparedness → Evacuation → Shelter → Recovery
43. Climate Change and Tropical Cyclones
Climate change complicates future cyclone risk.
The IPCC assesses that tropical-cyclone rainfall rates are expected to increase as the atmosphere warms and that the proportion of stronger tropical cyclones is projected to increase, while global tropical-cyclone frequency is projected to decrease or remain broadly unchanged depending on the metric and scenario.
This is an important distinction.
Climate change does not simply mean:
“More storms everywhere.”
The scientific picture is more nuanced.
Important changes include:
- greater atmospheric moisture;
- heavier extreme rainfall;
- changes in intensity distribution;
- changing regional exposure;
- sea-level rise;
- potentially greater storm-surge impacts;
- changes in storm behaviour and tracks in some regions.
44. Sea-Level Rise and Future Storm Surge
Even if a cyclone’s meteorological characteristics remained unchanged, rising sea level could increase coastal flooding.
Conceptually:
[
Future\ Flood\ Level =
Present\ Sea\ Level +
Sea\ Level\ Rise +
Storm\ Surge +
Wave\ Effects
]
Therefore, coastal risk can increase even without a proportional increase in cyclone frequency.
45. The Human Population Factor
A storm’s danger depends heavily on where people live.
Global coastal populations have expanded.
Human development has created:
- megacities;
- ports;
- industrial zones;
- coastal highways;
- power stations;
- airports;
- housing developments;
- tourism infrastructure.
Consequently, exposure can increase even if the physical hazard remains constant.
46. Infrastructure Interdependence
Modern infrastructure is interconnected.
A cyclone can simultaneously damage:
Electricity
↓
Telecommunications
↓
Water supply
↓
Hospitals
↓
Transport
↓
Food distribution
↓
Emergency response
A failure in one system can therefore amplify failures elsewhere.
This creates a network problem rather than a single-structure problem.
47. Engineering Against Cyclones
Modern cyclone-resilient engineering includes:
- stronger roof connections;
- reinforced concrete structures;
- improved drainage;
- elevated buildings;
- flood barriers;
- coastal defenses;
- resilient power systems;
- redundant communications;
- emergency shelters;
- stronger bridges;
- improved road drainage.
Engineering design should be based not simply on average conditions but on extreme-event probability.
48. The Digital Twin of a Storm
A future storm-response system can be conceptualized as a digital twin.
The system would combine:
Satellite data
Radar
Ocean observations
Weather stations
Numerical models
Population maps
Infrastructure databases
AI
to produce a continuously updated representation of the evolving hazard.
Such systems could estimate:
- expected wind;
- rainfall;
- flood depth;
- surge;
- road closures;
- power outages;
- hospital demand;
- evacuation requirements.
49. Artificial Intelligence
AI can potentially contribute to cyclone science through:
Pattern recognition
Identifying storm structures in satellite imagery.
Track prediction
Learning relationships between atmospheric states and historical tracks.
Intensity prediction
Identifying environmental patterns associated with strengthening or weakening.
Data assimilation
Helping integrate enormous observational datasets.
Impact prediction
Estimating which infrastructure and populations are likely to be affected.
Rapid forecasting
Producing forecasts more rapidly than some conventional computational workflows.
However, AI does not eliminate uncertainty.
Its predictions remain dependent on:
- training data;
- physical consistency;
- observational quality;
- model design;
- validation;
- changing climate conditions.
50. The Future of Storm Prediction
The next generation of forecasting is likely to combine:
[
Physics + Supercomputing + Satellites + AI + GIS + Human Expertise
]
rather than replacing physics with AI.
The most powerful architecture will likely be a hybrid system.
51. Toward Kilometer- and Sub-Kilometer-Scale Forecasting
Higher-resolution models can better represent:
- eyewall structure;
- convection;
- terrain;
- rainfall;
- coastlines;
- urban effects.
But higher resolution requires enormous computational resources.
This creates an important connection between cyclone science and:
- semiconductor technology;
- GPUs;
- CPUs;
- AI accelerators;
- supercomputers;
- high-speed networks;
- cloud computing.
Thus, modern storm forecasting is partly a computing problem.
52. The Semiconductor Connection
A weather forecast may involve billions or trillions of numerical calculations.
The computational chain is:
Atmospheric observations
→
Data assimilation
→
Numerical equations
→
Supercomputer
→
Forecast ensemble
→
Impact model
→
Warning
The quality of the final warning therefore depends upon an entire technological ecosystem.
53. The Communication Revolution
A perfect forecast is useless if nobody receives it.
Modern warning systems can use:
- television;
- radio;
- mobile phones;
- SMS;
- internet;
- social media;
- public-address systems;
- community leaders;
- sirens;
- emergency broadcasts.
The objective is last-mile communication.
54. Early Warning as a Technological System
An effective warning system has four major components:
1. Risk knowledge
Know what is vulnerable.
2. Monitoring and forecasting
Detect the hazard.
3. Warning dissemination
Communicate the threat.
4. Response capability
Enable people to act.
A failure in any one component can compromise the entire system.
55. Why Some Deadly Storms Produce Fewer Deaths Today
Forecasting technology has improved enormously.
But the deeper reason is preparedness.
WMO highlights the contrast between historically catastrophic cyclones and modern cases where accurate forecasts and mass evacuation have dramatically reduced mortality.
The historical record therefore demonstrates that technological progress can convert:
Unpredictable catastrophe
into
forecastable hazard
and eventually:
manageable risk.
56. The Course of a Storm as a Data Problem
Every storm can be represented as a time series:
[
S(t)=
[\lambda,\phi,P,V,R,S_z]
]
where:
- (\lambda) = longitude;
- (\phi) = latitude;
- (P) = central pressure;
- (V) = wind speed;
- (R) = rainfall;
- (S_z) = surge characteristics.
Researchers can then calculate:
- distance travelled;
- translation speed;
- direction changes;
- intensity changes;
- lifetime;
- accumulated cyclone energy;
- landfall points.
57. Accumulated Cyclone Energy
ACE combines cyclone intensity and duration into a single index.
Conceptually:
[
ACE \propto \sum V^2
]
over the storm’s lifetime, subject to the definition and units used by the relevant agency.
This is why a long-lived cyclone can accumulate extraordinary energy even if its peak intensity is not the world’s highest.
WMO noted that Freddy had exceptional accumulated cyclone energy for the Southern Hemisphere.
58. Three Different Meanings of “Deadliest”
A scientifically careful thesis must distinguish:
Highest mortality
Number of people killed.
Highest physical intensity
Wind or pressure extremes.
Greatest economic destruction
Financial losses.
These are not equivalent.
For example, WMO’s global disaster statistics for 1970–2019 identify Bhola as the leading tropical-cyclone mortality event, while Katrina ranks among the costliest storms in economic terms.
59. The Most Dangerous Storm Is Not Necessarily the Strongest
Consider three hypothetical storms.
Storm A
Category 5, open ocean, no landfall.
Enormous physical intensity, minimal mortality.
Storm B
Category 3, densely populated delta, major surge.
Moderate-to-high intensity, enormous mortality.
Storm C
Category 2, slow-moving, mountainous region, extreme rainfall.
Lower wind intensity, severe inland disaster.
Therefore:
[
Danger \neq Intensity
]
Instead:
[
Danger = Hazard \times Exposure \times Vulnerability
]
60. A 300-Year Evolution of Storm Science
The broad technological progression can be summarized as follows:
| Era | Principal capability |
|---|---|
| 1726–1800 | Human observation |
| 1800–1850 | Instrumental meteorology |
| 1850–1900 | Telegraph and organized observations |
| 1900–1940 | Radio and improved forecasting |
| 1940–1960 | Aircraft reconnaissance and radar |
| 1960–1980 | Meteorological satellites |
| 1980–2000 | Numerical prediction and digital computing |
| 2000–2010 | Global integrated observation |
| 2010–2020 | High-resolution modelling, GIS and big data |
| 2020–2026 | AI, advanced ensembles and integrated impact forecasting |
| Future | AI–physics hybrid forecasting and digital twins |
61. The Great Scientific Transition
The history of cyclone science can therefore be interpreted as a transition:
Era 1
We experience storms.
Era 2
We record storms.
Era 3
We observe storms.
Era 4
We track storms.
Era 5
We forecast storms.
Era 6
We forecast their impacts.
Era 7
We attempt to predict risk before the storm forms.
This represents one of the most significant achievements of modern atmospheric science.
62. The African Dimension
Africa is particularly important in future cyclone-risk research because the continent contains vulnerable coastal and inland populations while meteorological observation infrastructure remains uneven.
The southwest Indian Ocean is especially significant for:
- Madagascar;
- Mozambique;
- Malawi;
- Comoros;
- Mauritius;
- Seychelles;
- Réunion and surrounding territories.
Cyclones can cross national borders, meaning disaster management must also cross national boundaries.
63. South Africa
South Africa is generally less exposed to direct tropical-cyclone landfalls than Mozambique and Madagascar.
However, southern African weather systems can be influenced by tropical systems that move inland or interact with mid-latitude circulation.
The regional lesson is therefore that national boundaries do not define atmospheric hazards.
A cyclone affecting Mozambique can influence:
- regional rainfall;
- river systems;
- agriculture;
- transport;
- energy;
- food supply;
- cross-border migration.
64. Climate Resilience for Africa
A future African cyclone strategy should combine:
- satellite observation;
- regional weather radar;
- automated weather stations;
- river monitoring;
- flood modelling;
- resilient infrastructure;
- emergency telecommunications;
- community education;
- cyclone shelters;
- cross-border coordination;
- AI-supported forecasting;
- climate-risk mapping.
65. The Importance of Historical Memory
Historical cyclone records are not simply archives of destruction.
They are engineering datasets.
A city can study:
Past storm track
→
Past flood depth
→
Past infrastructure failure
→
Future hazard model
→
Improved building standard
The past becomes an input into future resilience.
66. Uncertainty Must Remain Central
Historical storm science contains uncertainties in:
- position;
- wind speed;
- central pressure;
- storm size;
- landfall time;
- mortality;
- surge;
- rainfall;
- geographical extent.
Older events may have large uncertainty ranges.
Scientific honesty therefore requires distinguishing:
observed
from
estimated
from
reconstructed
from
modelled.
67. The Problem of Historical Death Counts
Death tolls are particularly difficult to compare.
A historical estimate may include:
- direct deaths;
- missing people;
- shipwreck deaths;
- disease;
- famine;
- delayed deaths;
- indirect consequences.
Modern disaster databases attempt to standardize reporting, but uncertainty remains.
Consequently, rankings should be regarded as historical estimates rather than absolute numerical truths.
68. Why the 300-Year Story Is Really Two Stories
The first story is:
The evolution of the storms we experienced.
The second is:
The evolution of our ability to see them.
This distinction is crucial.
A modern database may appear to show increasing storm activity because modern satellites detect storms that earlier observers could never see.
Therefore:
[
Observed\ Storms =
Actual\ Storms \times Detection\ Capability
]
As detection capability increases, the observed record becomes more complete.
69. The Modern Global Observation Network
Today’s cyclone science is based on a planetary observation system.
It incorporates:
- satellites;
- radar;
- aircraft;
- ships;
- buoys;
- weather stations;
- radiosondes;
- ocean measurements;
- lightning observations;
- numerical models.
IBTrACS integrates information from multiple international agencies, making it a foundational global archive for cyclone research.
70. From Storm Track to Impact Track
The next scientific revolution is moving from tracking the centre of the cyclone to tracking the complete hazard field.
A traditional track says:
“The cyclone centre will pass here.”
An impact forecast should say:
“These communities may experience these winds, this rainfall, this surge, this flood depth and this infrastructure disruption.”
This is a much more useful form of forecasting.
71. The Future Storm-Intelligence Platform
A future global storm-intelligence platform could operate as:
Satellite constellation
↓
Real-time atmospheric data
↓
Ocean data
↓
AI-assisted data assimilation
↓
Physics-based ensemble models
↓
Cyclone track prediction
↓
Wind/rain/surge models
↓
Flood and infrastructure digital twins
↓
Population exposure analysis
↓
Automated risk maps
↓
Localized warnings
This is the emerging architecture of twenty-first-century disaster intelligence.
72. A New Definition of Storm Power
Storm power should not be measured by wind alone.
A comprehensive storm-power framework should include:
[
Storm\ Threat =
f(
Wind,
Pressure,
Size,
Duration,
Rainfall,
Surge,
Translation,
Exposure
)
]
A storm that is weaker in one category can be more dangerous because it is extreme in another.
73. The Ultimate Lesson of Bhola
Bhola demonstrates the destructive power of nature.
But the decades following Bhola demonstrate something equally important:
human vulnerability is not fixed.
Bangladesh has progressively developed:
- warnings;
- shelters;
- evacuation systems;
- community preparedness;
- meteorological capabilities.
The result is that later storms can produce dramatically lower mortality than historically comparable events.
74. The Ultimate Lesson of Freddy
Freddy demonstrates the opposite side of the problem.
Even with extraordinary technological observation, nature can produce highly unusual trajectories and longevity.
Its 36-day lifetime demonstrates that tropical-cyclone behaviour can remain extraordinarily complex even in the satellite era.
Therefore:
Technology does not eliminate extreme weather.
It improves our ability to understand and manage it.
75. The Ultimate Lesson of Idai
Idai demonstrates that tropical-cyclone disasters are not confined to coastlines.
A cyclone can become a continental-scale hydrological disaster.
This requires cooperation between:
- meteorologists;
- hydrologists;
- engineers;
- emergency managers;
- public-health authorities;
- telecommunications systems;
- local communities.
76. The Ultimate Lesson of Katrina
Katrina demonstrates that even wealthy and technologically advanced societies remain vulnerable.
Infrastructure can fail.
Communication can fail.
Evacuation can be incomplete.
Emergency systems can become overwhelmed.
Therefore:
[
Technology \neq Immunity
]
Technology increases resilience only when it is integrated into competent institutions and maintained infrastructure.
77. The Ultimate Lesson of Nargis
Nargis demonstrates the importance of communication, preparedness and institutional capacity.
A scientifically accurate cyclone forecast must ultimately become an understandable public warning.
The human interface is therefore part of meteorological engineering.
78. The Ultimate Lesson of the Three-Century Record
Across approximately three centuries, the basic physical laws governing tropical cyclones have not changed.
What has changed dramatically is humanity’s technological position.
We moved from:
looking at the sky
to
measuring the atmosphere
to
observing the planet from space
to
simulating the atmosphere inside supercomputers
to
using AI to extract patterns from enormous datasets.
This transformation represents one of the greatest achievements of Earth science.
79. The 2026 Perspective
By 2026, humanity possesses an unprecedented ability to monitor tropical cyclones.
Modern systems can provide:
- continuous satellite observations;
- high-frequency storm positions;
- intensity estimates;
- numerical ensemble forecasts;
- storm-surge modelling;
- rainfall prediction;
- flood modelling;
- GIS-based exposure analysis;
- automated warning dissemination.
NOAA’s Historical Hurricane Tracks platform allows researchers to examine historical cyclone tracks, maximum winds and minimum pressures using HURDAT2 and IBTrACS data.
The difference between 1726 and 2026 is therefore extraordinary.
In 1726:
The storm arrived.
In 2026:
The storm can often be observed days before arrival, modelled through multiple possible futures, and translated into location-specific risk information.
80. Conclusion
The approximately 300-year history of deadly storms is not simply a catalogue of hurricanes, typhoons and cyclones.
It is a history of the interaction between:
Earth’s atmosphere
Earth’s oceans
planetary rotation
climate
geography
human settlement
engineering
technology
governance
and scientific knowledge.
The great storms of history—from the catastrophic Atlantic hurricanes of the eighteenth and nineteenth centuries, through Galveston, Bhola, Bangladesh’s 1991 cyclone, Mitch, Katrina, Nargis, Haiyan, Idai and Freddy—demonstrate that the word “deadliest” has several meanings.
The storm with the strongest winds is not necessarily the storm that kills the most people.
The storm with the lowest pressure is not necessarily the storm that causes the greatest economic loss.
The storm with the longest track is not necessarily the storm with the greatest immediate human impact.
Instead, disaster emerges from the intersection of hazard, exposure and vulnerability.
The scientific history also reveals a remarkable technological transformation.
Humanity progressed from fragmented ship observations to:
barometers → telegraphs → radio → aircraft → radar → satellites → numerical weather prediction → supercomputers → GIS → global datasets → artificial intelligence.
Modern cyclone science therefore represents a convergence of atmospheric physics, oceanography, mathematics, computing, telecommunications, Earth observation, engineering and social science.
The historical record contains a profound warning.
Nature will continue generating extraordinary storms.
But the human consequences are not predetermined.
The reduction in mortality achieved through forecasting, evacuation, shelters, resilient infrastructure and public education demonstrates that scientific knowledge can transform disaster outcomes. Bangladesh provides one of the clearest examples, while Mozambique’s experience with Idai and Freddy illustrates the importance of continued investment in African early-warning and resilience systems.
The future objective should therefore not be merely to predict where the eye of a cyclone will travel.
The deeper objective is to construct a planetary system capable of answering, in near real time:
Where will the storm go?
How strong will it become?
How large will its hazard field be?
How much rain will fall?
Where will the water go?
Which roads will fail?
Which communities will be exposed?
Which infrastructure will be vulnerable?
Who needs to evacuate?
Where should emergency resources be positioned?
That is the transition from storm tracking to storm intelligence.
And it represents the next chapter in the three-hundred-year human attempt to understand, predict and survive Earth’s most powerful storms.
Selected Scientific and Technical Sources
- NOAA/NCEI — International Best Track Archive for Climate Stewardship (IBTrACS). The principal global best-track archive for historical and modern tropical cyclones.
- NOAA — Historical Hurricane Tracks. Global storm-track visualization and analysis using IBTrACS and HURDAT2.
- NOAA/National Hurricane Center — Deadliest Atlantic Tropical Cyclones. Historical catalogue of Atlantic cyclone mortality extending back to the early historical period.
- World Meteorological Organization — World Weather and Climate Extremes Archive. Historical extreme-event records, including Bhola and other major cyclone extremes.
- WMO Atlas of Mortality and Economic Losses. Comparative global disaster mortality and economic-loss statistics.
- WMO — Tropical Cyclone Freddy. Scientific assessment of Freddy’s record 36-day lifetime and approximately 12,785-km track.
- IPCC AR6 Working Group I. Assessment of observed and projected changes in tropical-cyclone rainfall, intensity and frequency.
- WMO — Mozambique Early Warning Systems. Case study of Idai, Freddy and the development of improved African early-warning capability.



Be First to Comment