
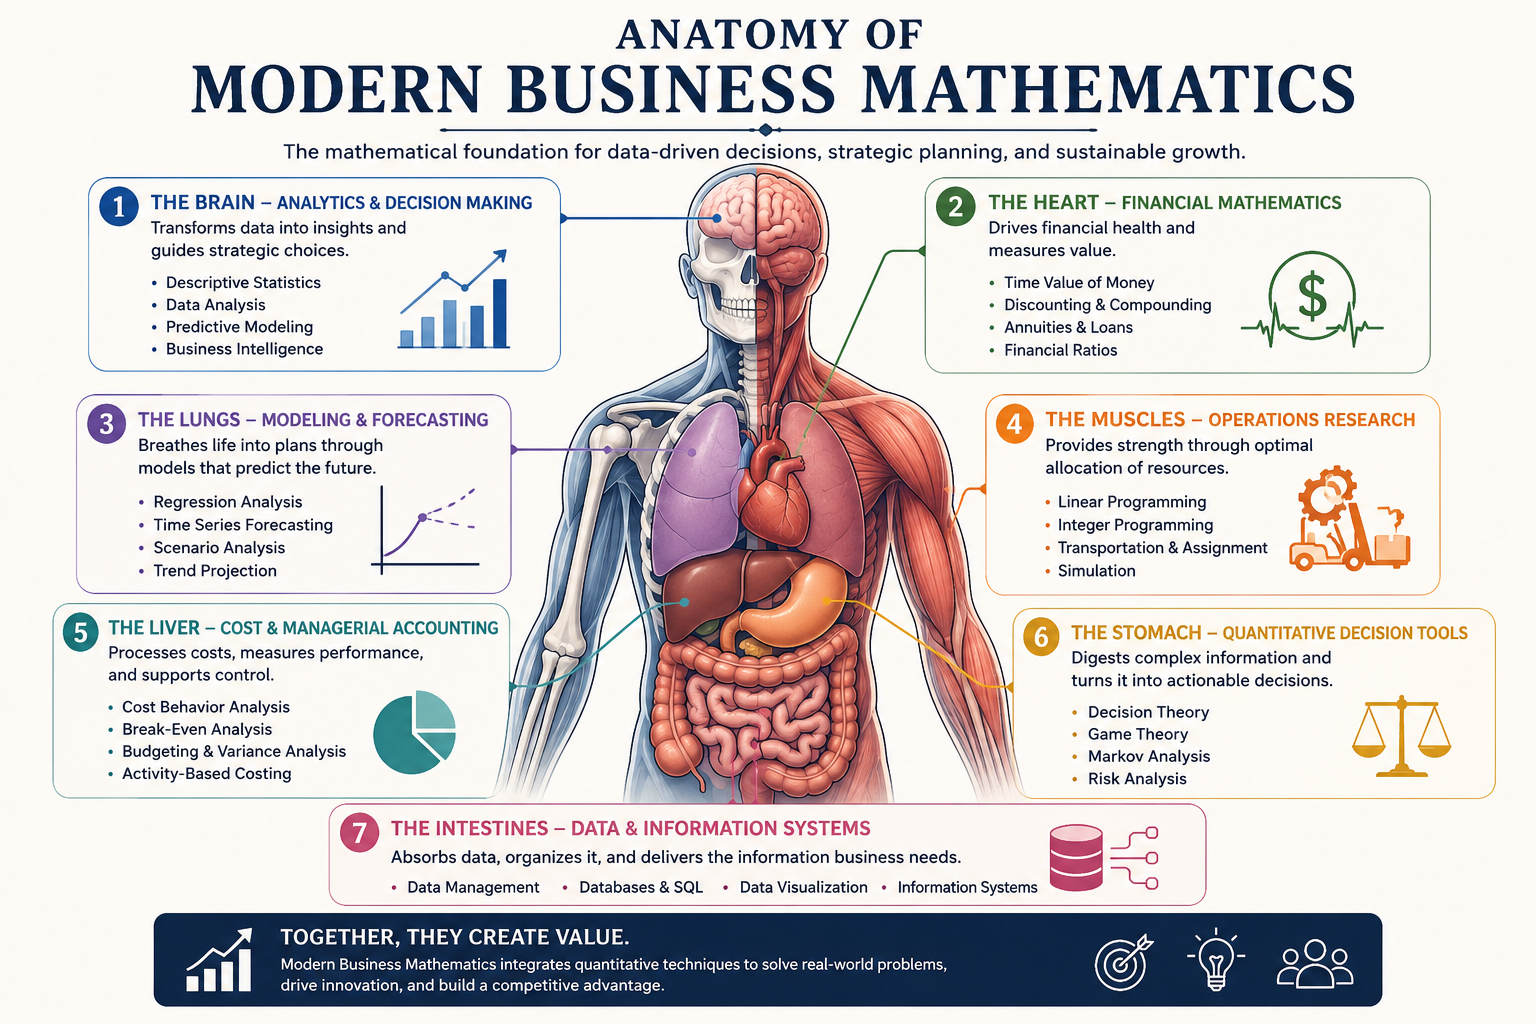
Business mathematics is the analytical core of commercial operations, financial management, and corporate strategy. Far from being a series of dry, abstract calculations, modern business math bridges foundational arithmetic with complex, data-driven decision models.
This comprehensive breakdown serves as an instructional blueprint to understand how mathematical structures shape business logic, risk assessment, and operational scaling.
1. The Core Functional Layers (The Anatomy)
Modern business mathematics is structurally divided into four foundational layers. Each layer builds upon the previous one to solve increasing levels of commercial complexity.
A. The Foundational Arithmetic Layer
This layer focuses on immediate transactions and baseline financial calculations.
- Core Concepts: Ratios, percentages, fractions, trade discounts, and basic margin calculations.
- Operational Purpose: Determining markups, markdowns, retail pricing policies, and net compensation after cash discounts.
B. The Time-Value Framework (Financial Mathematics)
Money does not hold a static value across time. This layer uses mathematical progressions to model the growth or erosion of capital.
- Core Concepts: Simple interest, compound interest, present value (PV), and future value (FV). Routledge
- Operational Purpose: Evaluating loan structures, managing mortgages, measuring corporate bond yields, and calculating asset depreciation schedules (such as linear or declining-balance methods).
- Annuities & Amortization: Structuring consistent recurring payments for pensions, equipment leasing, or sinking funds.
C. The Operational Optimization Layer (Linear & Matrix Algebra)
When businesses scale, managing individual variables becomes inefficient. Matrix models allow companies to solve multi-variable operational challenges simultaneously.
- Core Concepts: Systems of simultaneous linear equations, matrix operations, and determinants.
- Leontief’s Input-Output Model: A foundational matrix framework used to calculate how changes in one industry sector’s production levels ripple out to impact supply requirements across interconnected sectors.
- Linear Programming (LP): Maximizing profit or minimizing costs subject to strict operational constraints (e.g., labor hours, raw material caps). Scribd
D. The Strategic Risk & Predictive Layer (Stochastics & Calculus)
This layer manages uncertainty, dynamic change, and marginal efficiency.
- Probability & Statistics: Forecasting demand, evaluating the likelihood of venture success, and assessing credit risk profiles.
- Differential Calculus: Finding optimal operating points by calculating marginal revenue, marginal cost, and the exact elasticity of demand to achieve true profit maximization.
2. Modern Problem-Solving Methodology (The PUPP Tutorial Framework)
To apply these layers successfully without getting lost in formulas, modern business educators rely on structured framework processes. One of the most effective approaches utilized in current professional settings is the PUPP Model:
| Phase | Action | Description |
| Plan | Identify the Objective | Pinpoint what needs to be solved (e.g., finding the break-even point or maximum profit) and isolate the known variables. |
| Understand | Map the Formulas | Connect the business problem to its algebraic or financial formula equivalent. Select the correct timeline or matrix parameters. |
| Perform | Execute the Calculation | Utilize professional tools (such as financial calculators like the TI BAII+, spreadsheet templates, or matrix software) to run the numbers. |
| Present | Translate to Insight | Convert the raw mathematical value back into a practical business recommendation (e.g., “We must produce 450 units minimum to cover fixed overhead”). |
3. Practical Applied Scenarios
Scenario A: Break-Even Optimization
A business needs to determine the exact inflection point where total costs and total revenues balance out, allowing them to accurately forecast starting profitability.
Total Revenue=Total Fixed Costs+Total Variable Costs
By calculating this point, management can establish baseline sales targets, set viable market prices, and design accurate cash flow projections.
break even point or BEP or Cost volume profit graph of the sales units and the revenue sales. Source: Getty Images
Explore
Scenario B: Project Feasibility (Capital Budgeting)
Before greenlighting long-term logistics or expansion projects, firms run Discounted Cash Flow (DCF) models using the Net Present Value (NPV) formula:
NPV=t=1∑n(1+r)tCt−C0
Where:
- Ct = Net cash inflow during the period t
- C0 = Total initial investment costs
- r = Discount rate or cost of capital
- t = Number of time periods
If the resulting NPV is greater than zero, the project is mathematically projected to generate value above its capital costs, making it a sound strategic investment.
Business Mathematics: Articles, Anatomy, and Modern TutorialsBusiness mathematics is the bridge between numbers and decisions. It takes the formulas you learned in school and puts them to work on profit, pricing, risk, and growth. With the shift to online learning, the way we teach and consume it has changed too. Articles give context, anatomy breaks down the structure, and modern tutorials deliver practice.1. The “Articles” of Business MathematicsThink of articles as the lenses that show why the math matters. Good articles don’t just list formulas. They connect them to real business problems.Core themes you’ll find in modern articles:Financial decision-making: How compound interest, annuities, and present value shape loans, investments, and retirement plans.Cost and revenue analysis: Break-even points, marginal cost, elasticity, and how small changes in price affect profit.Operations and optimization: Linear programming, inventory models like EOQ, and queuing theory for staffing and logistics.Data-driven business: Descriptive statistics, probability, correlation, and basic forecasting that feed into dashboards and BI tools.The best articles in 2026 also address AI and automation. Instead of “calculate this by hand,” they ask “what should the model optimize for, and how do we interpret the output?”2. The Anatomy of Business MathematicsIf you strip business math down, it has 5 main systems that all connect:A. Arithmetic and Algebra Foundation
Percentages, ratios, indices, equations. This is the language. Every pricing strategy or discount calculation starts here.B. Financial MathematicsSimple and Compound Interest: Loans, savings, credit cardsTime Value of Money: Present Value PV=(1+r)nFV, Future Value, annuitiesDepreciation and Valuation: Straight-line, reducing balanceC. Commercial Mathematics
Profit and loss, discounts, commissions, taxes, insurance. This is the day-to-day math of retail, sales, and procurement.D. Calculus and Optimization in BusinessDerivatives: Marginal cost, marginal revenue, profit maximizationIntegration: Consumer and producer surplusLinear Programming: Resource allocation under constraintsE. Statistics and Probability
Mean, median, standard deviation, normal distribution, hypothesis testing, regression. This is what turns raw sales data into forecasts and decisions.Together, these form the skeleton. You can’t do good forecasting without statistics, and you can’t price well without calculus and algebra.3. Modern Tutorials: How People Learn It NowTutorials have moved past 40-minute lectures and textbook drills. The 2026 approach is modular, applied, and tool-based.What modern tutorials look like:Micro-lessons: 5-8 minute videos or interactive pages focused on one concept, like “calculate NPV in Excel” or “solve break-even with Python.”Tool-first learning: Instead of solving 20 problems by hand, you learn the concept, then immediately apply it in Excel, Google Sheets, R, Python, or AI copilots. Example: “Use Solver to maximize profit given constraints.”Case-based projects: Tutorials built around a real scenario. “You run a coffee shop in Sandton. Rent is R18,000. Price a latte to hit 20% margin.” You learn the math by making the decision.Interactive practice: Platforms now give instant feedback, graph the function as you change variables, and simulate “what if” scenarios.AI as tutor: You can ask “explain marginal cost like I’m 15” or “check my linear programming setup” and get step-by-step help without waiting for a class.A suggested learning path:Week 1-2: Percentages, ratios, profit/loss, simple and compound interestWeek 3-4: Functions, equations, break-even analysis, matrices for input-outputWeek 5-6: Derivatives for optimization, basic integration for business areasWeek 7-8: Descriptive stats, probability, regression, and forecasting with real dataOngoing: Capstone projects using spreadsheets and AI tools to model a real business problemBringing It TogetherArticles give you the “why.” Anatomy gives you the “what.” Modern tutorials give you the “how.”The shift is from memorizing formulas to using math as a decision tool. In business today, you won’t be asked to derive a formula on paper. You’ll be asked: “Given this data, what price maximizes profit, and how confident are we?” Business mathematics, taught through articles plus hands-on tutorials, trains exactly that.






Be First to Comment