
Abstract
Transporting 10,000 people to a single venue on one day is not simply a matter of hiring buses. It is a temporary transportation system that must integrate demand forecasting, passenger registration, vehicle scheduling, route planning, traffic management, safety, communications, accessibility, security, emergency response, parking, loading and unloading, and return transportation.
The central management principle is:
Move the right number of people, through the right transport corridors, at the right time, with sufficient capacity, safety and contingency to absorb disruption.
This thesis presents a practical framework for designing and managing such a project, using a hypothetical one-day event with 10,000 attendees.
1. Introduction
Large events create a temporary transportation problem because thousands of people attempt to travel toward the same destination within a relatively short period.
A normal city transport network distributes passengers throughout the day. An event can reverse this pattern:
10,000 people → multiple origins → limited arrival window → one venue
and later:
one venue → 10,000 people → multiple destinations → concentrated departure period
This creates two different transport problems:
Inbound transportation
People must arrive safely before the event begins.
Outbound transportation
People must leave safely after the event, often when demand becomes highly concentrated.
The outbound phase can actually be more difficult because thousands of people may attempt to leave almost simultaneously.
2. Project Objective
The transportation project’s objectives are:
- Transport approximately 10,000 attendees.
- Deliver passengers safely to the venue.
- Minimise unnecessary waiting.
- Prevent dangerous crowd accumulation.
- Maintain predictable arrival times.
- Provide transportation for people with disabilities and other mobility requirements.
- Maintain emergency access.
- Coordinate buses, minibuses, taxis, private vehicles and pedestrian movement.
- Provide reliable return transportation.
- Have contingency capacity for breakdowns, delays and unexpected demand.
The project should therefore be treated as a temporary transport network, not simply as a bus-hire exercise.
3. Fundamental Transport Architecture
A useful conceptual architecture is:
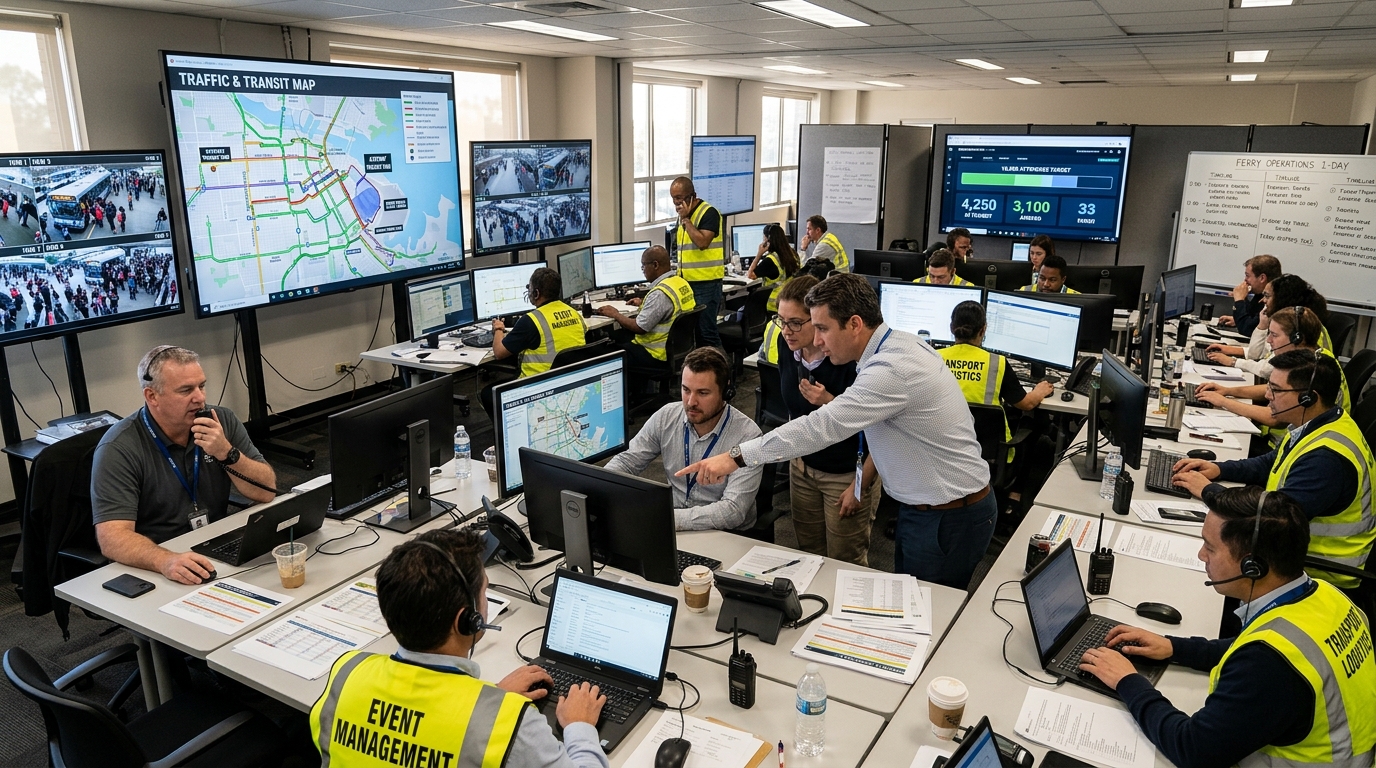
                    EVENT TRANSPORT CONTROL CENTRE
                              │
        ┌─────────────────────┼──────────────────────┐
        │                     │                      │
   Operations             Safety/Security        Communications
        │                     │                      │
        └─────────────────────┼──────────────────────┘
                              │
                    TRANSPORT NETWORK
                              │
        ┌───────────────┬────┴────┬───────────────┐
        │               │         │               │
   Pickup Zones     Park & Ride  Rail/Taxi      Special Needs
        │               │         │               │
        └───────────────┴────┬────┴───────────────┘
                             │
                         VENUE
                             │
                   ┌─────────┴─────────┐
                   │                   │
              Arrival Gates        Departure Gates
This architecture separates planning, vehicle operations, passenger movement, and venue management.
4. The First Critical Question: How Many People Are Actually Using Organised Transport?
The headline number is 10,000 people, but that does not necessarily mean 10,000 bus passengers.
For example, a planning scenario might assume:
| Transport mode | People |
|---|---|
| Organised buses | 6,000 |
| Minibuses/shuttles | 1,000 |
| Rail/public transport | 1,000 |
| Private vehicles | 1,500 |
| Taxi/e-hailing/drop-off | 500 |
| Total | 10,000 |
The actual modal split must be established during registration and ticketing.
This is one of the most important planning variables.
5. Passenger Demand Forecasting
Suppose the event begins at 10:00.
It would be dangerous to assume that all 10,000 passengers will arrive at exactly 09:45.
Instead, create an arrival curve.
Example:
| Time | Expected cumulative arrivals |
|---|---|
| 07:00 | 500 |
| 08:00 | 2,000 |
| 08:30 | 3,500 |
| 09:00 | 5,500 |
| 09:30 | 8,000 |
| 10:00 | 9,500 |
| 10:15 | 10,000 |
This gives the transport manager a time-distributed demand model.
The same analysis must be performed for departure.
6. The Transport Capacity Equation
A fundamental planning equation is:
where:
- = passenger capacity per hour
- = number of vehicles
- = passenger capacity per vehicle
- = number of trips per vehicle per hour
For example, suppose:
- 50 buses
- 50 passengers per bus
- each bus completes 1.5 trips per hour
Then:
If 6,000 passengers need organised bus transportation, the operation needs either more buses, more efficient vehicle turnaround, a longer arrival window, or a combination.
7. Why Vehicle Turnaround Is Critical
The bus does not simply travel from origin to venue.
A complete cycle may be:
Pickup
  ↓
Passenger boarding
  ↓
Travel to venue
  ↓
Passenger unloading
  ↓
Travel back
  ↓
Return to pickup area
  ↓
Board next passengers
The cycle time is therefore:
If the complete cycle takes 80 minutes, a vehicle cannot realistically perform three trips per hour.
This is why route distance and traffic conditions directly determine fleet requirements.
8. Example Fleet Calculation
Assume:
- 10,000 total attendees
- 7,000 require organised transportation
- average bus capacity = 50 passengers
- operational planning load = 45 passengers per bus
- average round-trip cycle = 90 minutes
- arrival window = 3 hours
The theoretical passenger movements per bus are approximately:
Therefore, each bus can theoretically carry:
passengers during the arrival period.
For 7,000 passengers:
So approximately 78 buses would be required under these assumptions.
However, this is not the final fleet size.
A professional plan would add contingency capacity.
For example:
- operational fleet: 78
- standby buses: 8
- special-needs vehicles: separately allocated
- maintenance/recovery vehicle: separately allocated
Thus, the contracted fleet could be approximately 86 buses, depending on actual route and vehicle specifications.
9. Passenger Pickup Zones
Instead of allowing 10,000 people to converge randomly on the venue, establish organised transportation hubs.
For example:
ZONE A ─────┐
ZONE B ─────┤
ZONE C ─────┤
ZONE D ─────┼────→ VENUE
ZONE E ─────┤
ZONE F ─────┤
ZONE G ─────┘
Each zone should have:
- passenger identification
- queue management
- signage
- security
- marshals
- bus allocation
- departure schedule
- emergency contact
- passenger information
- accessible boarding facilities where required.
10. Transport Hubs
A large pickup hub should function like a temporary transport station.
Example architecture
                 ENTRY
                   ↓
          Passenger Information
                   ↓
             Queue Area
                   ↓
          Ticket/Group Check
                   ↓
           Boarding Allocation
                   ↓
          ┌───────┼───────┐
          ↓       ↓       ↓
        BUS 1   BUS 2   BUS 3
          │       │       │
          └───────┼───────┘
                  ↓
                EXIT
Passengers should not be allowed to wander among moving buses.
11. Passenger Segmentation
The 10,000 passengers should be divided into manageable groups.
Possible segmentation:
- geographic zones
- ticket categories
- schools/organisations
- corporate groups
- family groups
- VIPs
- accessibility requirements
- staff
- performers
- contractors.
A simple digital system could assign:
Passenger → Pickup Zone → Bus → Departure Time → Venue Gate
This significantly improves control.
12. Digital Ticketing and Passenger Management
A modern event transport system can use QR codes or electronic tickets.
Example:
PASSENGER
   ↓
QR CODE
   ↓
PICKUP ZONE
   ↓
BUS NUMBER
   ↓
DEPARTURE TIME
   ↓
VENUE GATE
The objective is not surveillance; it is operational coordination.
The system should collect only information genuinely required for transport management and comply with applicable privacy requirements.
13. Bus Scheduling
A master schedule should contain:
| Bus | Pickup zone | Departure | Destination | Capacity | Status |
|---|---|---|---|---|---|
| B001 | A | 07:00 | Venue | 50 | Ready |
| B002 | A | 07:10 | Venue | 50 | Ready |
| B003 | B | 07:00 | Venue | 50 | En route |
| B004 | C | 07:15 | Venue | 50 | Boarding |
The control centre should know the status of every vehicle.
14. Vehicle Status System
A simple status model can be:
GREEN
Normal operation.
AMBER
Delayed or experiencing a minor problem.
RED
Major incident, breakdown or route blockage.
This allows the transport command centre to react quickly.
15. Real-Time Fleet Tracking
Where appropriate, GPS-enabled fleet tracking can provide:
- vehicle location
- estimated arrival time
- route deviation
- excessive delays
- vehicle inactivity
- congestion detection.
A dashboard could look conceptually like:
TRANSPORT CONTROL

Vehicles:              86
Moving:                54
At pickup:             18
At venue:              10
Standby:                4

Passengers transported: 5,420
Expected:               7,000

Delayed vehicles:        3
Critical incidents:      0
16. Venue Traffic Architecture
The venue should not have one combined entrance for buses, private vehicles, pedestrians and emergency vehicles.
Separate flows wherever practical.
                 VENUE
                   │
      ┌────────────┼────────────┐
      ↓            ↓            ↓
   BUSES       PRIVATE        TAXI/
               VEHICLES       DROP-OFF
      │
      ↓
 BUS UNLOADING AREA
      │
      ↓
 PEDESTRIAN GATES
An emergency access corridor should remain protected.
17. Bus Loading and Unloading
A bus should never simply stop wherever the driver finds space.
Designated bays should be established.
For example:
BUS BAY 1
BUS BAY 2
BUS BAY 3
BUS BAY 4
BUS BAY 5
BUS BAY 6
     ↓
PEDESTRIAN CORRIDOR
     ↓
SECURITY
     ↓
VENUE
Marshals should control vehicle movement.
18. Traffic Management
Traffic management must consider:
- intersections
- traffic signals
- road capacity
- construction
- roadworks
- pedestrian crossings
- parking
- public transport
- emergency routes
- weather
- road accidents
- peak-hour traffic.
The route should be tested before event day.
A route that looks good on a map may fail in real traffic.
19. Route Risk Assessment
Every major route should be evaluated for:
Probability
How likely is a problem?
Impact
How serious would the problem be?
A basic risk matrix:
| Risk | Probability | Impact | Response |
|---|---|---|---|
| Traffic congestion | High | High | Alternate route |
| Bus breakdown | Medium | Medium | Standby vehicle |
| Severe weather | Medium | High | Weather plan |
| Lost passenger | Medium | Medium | Information centre |
| Road closure | Low/Medium | High | Diversion route |
| Medical emergency | Medium | High | Emergency response |
20. The Importance of Buffer Time
A common planning mistake is scheduling every vehicle with zero spare time.
Suppose:
It would be dangerous to build the entire system around exactly 40 minutes.
Instead:
The buffer absorbs:
- congestion
- boarding delays
- traffic lights
- passenger movement
- minor incidents.
21. Transport Command Centre
The project should have a central command centre.
Core departments
                    PROJECT DIRECTOR
                           │
                    TRANSPORT MANAGER
                           │
       ┌───────────┬───────┼────────┬───────────┐
       ↓           ↓       ↓        ↓           ↓
    Dispatch    Traffic  Safety   Security   Passenger
               Control            Control    Information
The command centre should maintain one operational picture.
22. Communications System
There should be several communication layers:
Primary
Radio/mobile communication between operational teams.
Secondary
Telephone/mobile networks.
Passenger communication
- SMS
- event application
- WhatsApp or approved messaging channel
- digital signage
- public-address systems.
Emergency communication
A dedicated escalation procedure.
23. Transport Staff
A 10,000-person event requires more than drivers.
Potential personnel include:
- transport manager
- dispatchers
- route supervisors
- bus drivers
- traffic marshals
- passenger marshals
- parking controllers
- security personnel
- medical staff
- accessibility assistants
- communications personnel
- mechanics/recovery personnel
- command-centre staff.
Every role needs a defined responsibility.
24. Driver Management
Drivers should receive a briefing before operations.
The briefing should cover:
- route
- pickup location
- destination
- passenger capacity
- departure schedule
- communication procedures
- emergency procedures
- breakdown procedures
- prohibited stopping locations
- rest requirements.
Drivers should never improvise routes unless instructed through the approved operational chain.
25. Driver Fatigue
A one-day project can still create fatigue problems because preparation may begin hours before the event.
Scheduling should account for:
- legal driving-hour requirements
- breaks
- shift changes
- meal periods
- rest
- night operations where applicable.
Driver safety is part of passenger safety.
26. Accessibility
The transport system must accommodate passengers with disabilities and other mobility requirements.
This may require:
- wheelchair-accessible vehicles
- accessible boarding
- priority seating
- trained personnel
- accessible toilets at hubs
- accessible venue entrances
- appropriate communication.
Accessibility should be integrated during planning rather than added after the system is built.
27. Security
Security should protect passengers without creating unnecessary bottlenecks.
Security planning may include:
- controlled pickup areas
- venue screening
- lost-person procedures
- restricted vehicle areas
- controlled access
- emergency evacuation routes
- coordination with relevant authorities.
Security and transport must operate as one system because excessive security delays can become a transport problem.
28. Medical and Emergency Response
The transport plan should integrate emergency medical response.
A simple hierarchy:
Minor Incident
      ↓
On-site First Aid
      ↓
Medical Assessment
      ↓
Emergency Services if Required
      ↓
Hospital / Appropriate Medical Facility
Emergency routes must never be blocked by buses, parked cars or crowds.
29. Lost Passenger Management
Large events inevitably create passenger-information problems.
There should be a clearly identified:
Passenger Assistance Centre
It can handle:
- lost passengers
- missing groups
- incorrect bus allocation
- transport questions
- accessibility assistance
- emergency reunification.
30. Weather Planning
Weather can radically change transport performance.
Possible disruptions include:
- heavy rain
- flooding
- strong winds
- extreme heat
- lightning
- reduced visibility.
The plan should contain predefined responses.
For example:
WEATHER WARNING
      ↓
CONTROL CENTRE
      ↓
ASSESS ROAD + VENUE CONDITIONS
      ↓
NORMAL / MODIFIED / SUSPENDED
      ↓
COMMUNICATE DECISION
31. Breakdown Management
A vehicle breakdown should not collapse the whole system.
Example:
BUS BREAKDOWN
      ↓
Driver informs control
      ↓
Location confirmed
      ↓
Passengers protected
      ↓
Replacement vehicle dispatched
      ↓
Passengers transferred
      ↓
Recovery vehicle handles disabled bus
      ↓
Incident recorded
This is why standby capacity matters.
32. The 15-Minute Problem
Consider a simple scenario.
If 500 people arrive at a pickup location within 15 minutes and each bus carries 50 passengers:
At least 10 bus-loads are required.
If boarding takes 10 minutes per bus and only one loading bay is available, the system may become congested.
Therefore:
Vehicle capacity alone does not determine transport capacity.
The physical loading infrastructure also determines throughput.
33. Passenger Throughput
A useful concept is:
Suppose a pickup facility processes:
but demand reaches:
Then a queue develops.
The transport manager must therefore design the system around peak demand, not average demand.
34. Queue Management
Queues should be designed rather than allowed to form randomly.
ENTRANCE
   ↓
QUEUE 1
   ↓
CHECK
   ↓
QUEUE 2
   ↓
BUS ALLOCATION
   ↓
BOARDING
Barriers, signs and marshals can prevent passengers from entering vehicle movement areas.
35. Event-Day Timeline
A hypothetical timeline could look like:
04:00–05:00
Operations team arrives.
05:00–06:00
Transport hubs become operational.
06:00–07:00
First vehicles positioned.
07:00–09:30
Major passenger arrival period.
09:30–10:00
Final arrivals and late passengers.
10:00
Event begins.
During event
Fleet repositioning and readiness for departure.
16:00
First departure preparations.
17:00–19:00
Major passenger departure period.
19:00+
Final passengers and vehicle reconciliation.
After operation
Equipment recovery and reporting.
36. The Return Journey
The return operation must be designed before the event starts.
A common mistake is:
“We will figure out the buses after the event.”
That is unacceptable for a 10,000-person operation.
Return transportation needs:
- departure zones
- passenger queues
- destination allocation
- bus staging
- dispatch sequence
- crowd management
- emergency access
- late-departure procedures.
37. Staging Buses
Buses should not all be parked immediately next to the venue.
A staging system can be used:
REMOTE BUS STAGING
        ↓
DISPATCH CONTROL
        ↓
VENUE BUS HOLDING AREA
        ↓
LOADING BAY
        ↓
PASSENGERS
        ↓
DEPARTURE
This prevents excessive congestion.
38. Wave Departure Model
Instead of releasing thousands of passengers simultaneously, departure can occur in waves.
Example:
| Wave | Passengers | Destination groups |
|---|---|---|
| 1 | 2,000 | Zones A–B |
| 2 | 2,000 | Zones C–D |
| 3 | 2,000 | Zones E–F |
| 4 | 2,000 | Zones G–H |
| 5 | 2,000 | Final/other |
The exact system depends on the event schedule and passenger preferences.
39. Passenger Information
Passengers should receive information before travelling.
A transport information message should communicate:
- where to go
- when to arrive
- which bus/zone to use
- what identification is required
- expected journey duration
- where to exit
- return transportation instructions
- emergency contact information.
Good information reduces operational pressure.
40. Transport Management Technology
A modern system could integrate:
Passenger database
Passenger ID
Zone
Ticket
Bus
Time
Status
Fleet management
Vehicle ID
Driver
Location
Route
Status
Capacity
Operations dashboard
Demand
Capacity
Vehicles
Traffic
Incidents
Weather
Passenger flow
This creates a digital representation of the physical transport system.
41. Data and Analytics
After the event, data should be analysed.
Useful measurements include:
On-time departure rate
Vehicle utilisation
Average waiting time
Load factor
These metrics allow future events to be planned more accurately.
42. Financial Management
The transport budget should include:
Direct costs
- bus hire
- driver costs
- fuel
- tolls
- parking
- traffic management
- security
- communications
- technology
- signage
- barriers
- medical services
- contingency.
Indirect costs
- project management
- administration
- insurance
- permits
- planning
- venue coordination.
A contingency budget should be established rather than spending 100% of the available budget on the base plan.
43. Example Budget Structure
| Category | Planning allocation |
|---|---|
| Vehicle hire | 45% |
| Drivers/operations | 12% |
| Traffic management | 8% |
| Security | 8% |
| Technology/communications | 5% |
| Passenger facilities | 5% |
| Medical/emergency | 3% |
| Signage/equipment | 4% |
| Contingency | 10% |
| Total | 100% |
These are planning proportions, not universal prices.
Actual South African costs would need quotations from transport operators and service providers.
44. Procurement
Transport suppliers should be evaluated against measurable requirements.
For example:
- number of vehicles
- vehicle capacity
- vehicle age/condition
- insurance
- licensing
- driver qualifications
- maintenance records
- GPS capability
- accessibility
- emergency support
- replacement vehicle availability
- cancellation terms.
The cheapest quotation should not automatically define the transport architecture.
45. Contract Structure
A transport contract should clearly define:
Supplier responsibility
vs.
Event organiser responsibility
vs.
Venue responsibility
vs.
Traffic/security authority responsibility
This prevents confusion during an incident.
46. Legal and Regulatory Compliance
For a real event, the organiser must verify all applicable South African requirements concerning:
- passenger transport operators
- driver licensing
- vehicle licensing
- roadworthiness
- insurance
- traffic management
- occupational health and safety
- venue requirements
- accessibility
- privacy/data protection
- municipal permissions
- emergency services.
Requirements can vary according to the vehicle type, route, province and operating arrangement, so they should be confirmed with the relevant authorities and qualified professionals.
47. Command-and-Control Model
A strong command structure might be:
EVENT DIRECTOR
      │
TRANSPORT DIRECTOR
      │
┌─────┼────────┬────────┬─────────┐
│     │        │        │         │
Fleet Traffic Passenger Safety Communications
│     │        │        │         │
Drivers Marshals Staff    Security Dispatch
Every operational employee should know:
Who do I report to?
Who makes the decision?
Who replaces me?
Who do I contact during an emergency?
48. Incident Escalation
A simple system:
Level 1 — Minor
Example: one delayed bus.
Handled by local supervisor.
Level 2 — Significant
Example: several buses delayed.
Transport control intervenes.
Level 3 — Major
Example: road closure affecting thousands.
Project command centre activates contingency plan.
Level 4 — Emergency
Example: serious safety incident.
Emergency services and event command structure take control according to the emergency plan.
49. Contingency Planning
Every major assumption should have a backup.
| Primary system | Backup |
|---|---|
| Main route | Alternative route |
| Main bus | Standby bus |
| GPS | Radio/phone |
| Main pickup site | Secondary site |
| Main communications | Backup channel |
| Normal weather | Weather plan |
| Normal traffic | Traffic diversion |
| Main power | Backup power |
The philosophy is:
Assume that something will fail; design the system so one failure does not become a system-wide failure.
50. Simulation Before Event Day
The best transport plans should be tested.
A simulation can model:
- 10,000 passengers
- vehicle arrivals
- vehicle departures
- route travel times
- boarding times
- unloading times
- traffic delays
- breakdowns
- passenger queues.
A tabletop exercise can ask:
What happens if 20 buses are delayed by 30 minutes?
Then:
What happens if a major road becomes unavailable?
Then:
What happens if 2,000 passengers leave simultaneously?
This reveals weaknesses before the real event.
51. Full Operational Cycle
The entire project can be understood as:
                PLANNING
                   ↓
             REGISTRATION
                   ↓
            DEMAND FORECAST
                   ↓
             FLEET DESIGN
                   ↓
             ROUTE DESIGN
                   ↓
          SUPPLIER PROCUREMENT
                   ↓
           STAFF RECRUITMENT
                   ↓
             RISK ASSESSMENT
                   ↓
               SIMULATION
                   ↓
             EVENT DAY
                   ↓
              DISPATCH
                   ↓
             PASSENGER FLOW
                   ↓
              VENUE ARRIVAL
                   ↓
             EVENT OPERATION
                   ↓
             DEPARTURE WAVES
                   ↓
              RETURN JOURNEY
                   ↓
             VEHICLE RECONCILIATION
                   ↓
            PERFORMANCE ANALYSIS
                   ↓
             FINAL REPORT
52. Key Performance Indicators
A professional project should measure:
Passenger metrics
- total passengers
- passengers transported
- average waiting time
- maximum waiting time
- passengers arriving late.
Vehicle metrics
- number of vehicles
- utilisation
- breakdowns
- average turnaround time
- empty kilometres.
Safety metrics
- accidents
- injuries
- medical incidents
- security incidents.
Operational metrics
- on-time departures
- on-time arrivals
- route delays
- queue length
- missed departures.
Financial metrics
- total transport cost
- cost per passenger
- contingency expenditure
- supplier performance.
53. Cost Per Passenger
One particularly useful management metric is:
For example, if the transport programme costs R1,500,000 and carries 7,500 passengers:
The figure should be interpreted alongside service quality, safety and capacity requirements rather than in isolation.
54. Sustainability
A modern event transport system should also consider environmental impact.
Strategies include:
- reducing unnecessary empty trips
- consolidating passengers
- efficient routing
- appropriate vehicle sizing
- park-and-ride systems
- public transport integration
- electric or lower-emission vehicles where operationally suitable.
The environmental objective can be represented as:
subject to safety and operational constraints.
55. The Event as a Temporary City
One of the most useful ways to understand the project is to treat the venue and transport system as a temporary city.
The 10,000 people require:
- roads
- transport
- information
- security
- healthcare
- communication
- electricity
- water
- sanitation
- pedestrian infrastructure
- emergency services.
Therefore, event transport management is actually a form of temporary urban infrastructure management.
56. Master Transport Dashboard
The final control dashboard could contain:
╔══════════════════════════════════════════╗
║       10,000-PERSON EVENT TRANSPORT      ║
╠══════════════════════════════════════════╣
║ PASSENGERS                               ║
║ Registered:             10,000           ║
║ Transported:             7,240           ║
║ Remaining:               2,760           ║
╠══════════════════════════════════════════╣
║ FLEET                                   ║
║ Active:                     72           ║
║ Standby:                     8           ║
║ Delayed:                     2           ║
║ Breakdown:                   0           ║
╠══════════════════════════════════════════╣
║ OPERATIONS                              ║
║ On time:                   94%            ║
║ Average wait:             11 min          ║
║ Critical incidents:        0              ║
╠══════════════════════════════════════════╣
║ SAFETY                                  ║
║ Medical incidents:         2              ║
║ Major incidents:           0              ║
╚══════════════════════════════════════════╝
This transforms thousands of individual movements into a manageable operational picture.
57. Ten Golden Principles
1. Plan demand before vehicles.
Know how many people need transport and when.
2. Design for the peak.
Average demand does not cause queues; peak demand does.
3. Separate transport flows.
Keep buses, pedestrians, private vehicles and emergency vehicles appropriately separated.
4. Build redundancy.
Have backup vehicles, routes and communications.
5. Control the passenger journey.
Pickup → boarding → transport → arrival → event → departure.
6. Protect emergency access.
Never allow event congestion to eliminate emergency routes.
7. Use technology as an operational tool.
GPS, QR tickets and dashboards should support people rather than replace operational judgement.
8. Brief everyone.
Drivers, marshals, security, venue staff and passengers need clear information.
9. Plan the return journey first-class.
The event does not finish when the last performance ends; transportation continues until passengers are safely dispersed.
10. Measure everything.
Data from the first event becomes the planning foundation for the next event.
58. Conclusion
A one-day transportation project for 10,000 people is essentially a temporary, high-volume transportation network.
Its success depends on integrating:
People + Vehicles + Roads + Time + Information + Safety + Technology + Contingency.
The most important mathematical relationship is not simply the number of buses. It is:
But real-world performance additionally depends on:
Therefore, the professional approach is to design the complete system before event day, simulate its performance, establish command and contingency structures, operate it through a central control centre, and measure the results afterward.
For a 10,000-person event, the ultimate objective is not merely moving 10,000 people. It is creating a transportation system in which 10,000 individual journeys behave like one coordinated operation.


Be First to Comment