
The Stark Reality of South Africa’s Tax Base
South Africa’s tax system reveals a startling truth that few fully grasp: approximately 2.6% of the population—just 1.66 million people out of 64 million—pay 76.2% of all personal income tax. This concentration represents one of the most unequal tax burdens in the world, where a tiny fraction of citizens shoulder the financial responsibility for an entire nation’s development.
In the 2024/25 fiscal year, the South African Revenue Service (SARS) collected an impressive R2.3 trillion in gross tax revenue. Yet this achievement masks a deeper structural challenge: Personal Income Tax remains the largest contributor at 39.5% of total tax revenue, followed by VAT at 26.5% and Corporate Income Tax at 17.4%. The country’s tax-to-GDP ratio reached a record high of 25.1% in 2025, among the highest in Africa and well above the continental average of 16%.
Geographic Distribution: Where the Money Comes From
Gauteng: The Economic Powerhouse
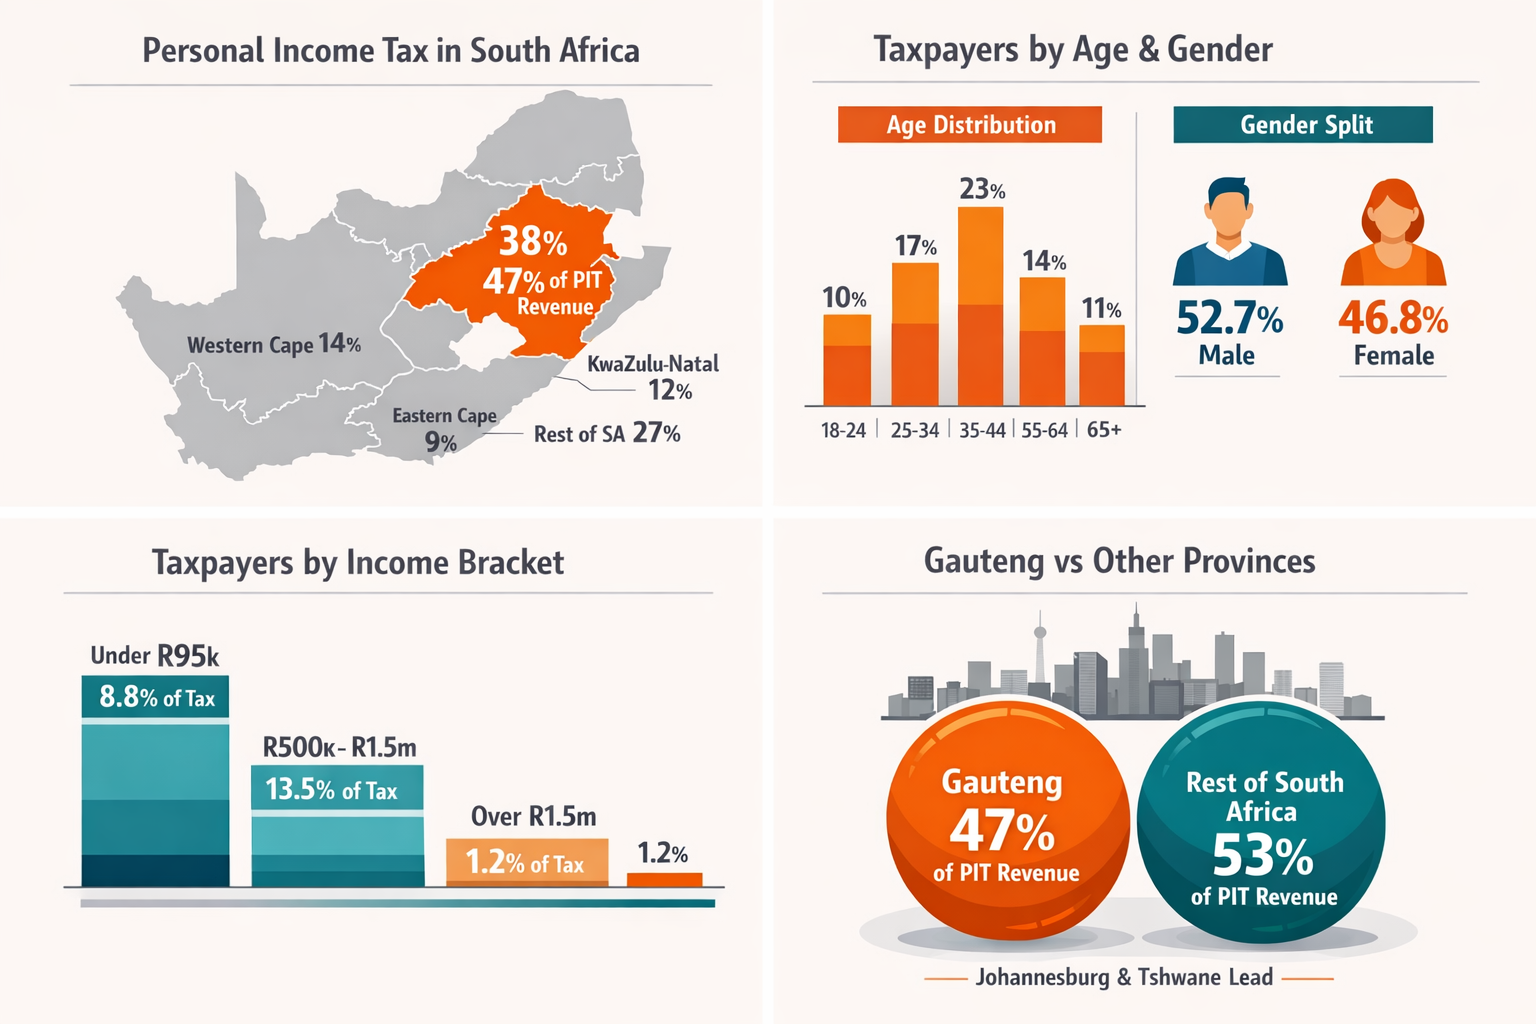
Gauteng accounts for 38% of registered taxpayers and contributes 47% of the country’s personal income tax. This economic dominance is remarkable considering the province represents only 25% of South Africa’s population. Within Gauteng, the wealth is further concentrated in specific municipalities.
The Johannesburg Metro alone has 855,274 assessed taxpayers with an average taxable income of R484,672. Johannesburg and Tshwane stand out as the wealthiest municipalities, both maintaining average taxable incomes exceeding R400,000. Notably, every municipality within Gauteng reports average taxable income above R300,000, underscoring the province’s consistent economic strength.
The data from 2023 reveals that 2,361,099 (35.5%) of all assessed taxpayers were registered in Gauteng, cementing its position as the nation’s financial heartbeat.
The Rest of South Africa
While detailed provincial breakdowns beyond Gauteng are limited in recent statistics, the pattern is clear: economic activity and tax contributions follow population density and industrial concentration. The Western Cape, with Cape Town as its anchor, represents the second-largest contributor, followed by KwaZulu-Natal with Durban’s port and manufacturing base.
Rural provinces struggle significantly. The lack of formal employment opportunities in provinces like Limpopo, Eastern Cape, and North West means their tax contributions remain disproportionately low despite housing millions of residents.
Demographic Breakdown: Age and Gender
Age Distribution of Taxpayers
The bulk of South Africa’s tax base sits squarely in the working-age population. Taxpayers aged 35 to 44 represent 26.7% of assessed taxpayers (1,775,779 individuals), making this the single largest contributing age group. The 25 to 54 age range collectively carries the heaviest burden, representing the most economically productive years when earnings peak.
This concentration creates a vulnerability: as this cohort ages toward retirement, South Africa faces a potential tax revenue crisis unless younger generations can replace their contributions—a challenge given youth unemployment rates exceeding 42%.
The Gender Tax Gap
The statistics reveal a persistent gender imbalance in tax contributions. Of assessed taxpayers, 52.6% (3,495,942) were male while 47.4% (3,148,808) were female.
More concerning is the income distribution by gender. Males out-earn females in every income category except the R350,000 to R500,000 bracket, with the imbalance most notable in top brackets where less than a third of females earn over R1 million. This disparity reflects broader societal inequalities in career advancement, wage negotiations, and access to high-paying sectors.
Sectoral Analysis: Who Generates the Wealth?
Personal Income Tax by Employment Sector
The sectoral breakdown of personal income tax reveals which industries truly drive the economy. The finance, insurance, real estate, and business services sector accounts for R316 billion, representing 45% of all individual tax collected. This dominance reflects both the high salaries in financial services and the concentration of these industries in Gauteng’s urban centers.
The second-largest contributor is the community, social, and personal services sector, which includes government and public service. This represents a unique situation where government employees, funded by taxes, themselves constitute major taxpayers—essentially a circular flow of public funds.
Corporate Tax Contributors
Corporate income tax shows even greater concentration than personal income tax. Of the 1,166,692 companies assessed for the 2022 tax year, only 20.7% declared positive taxable income, 54.6% reported zero taxable income, and 24.7% reported losses. This means fewer than one in five companies actually pay corporate tax.
Among profitable companies, the concentration is extreme: Just 549 large companies (0.2% of companies with positive taxable income) each with taxable income exceeding R200 million were liable for 66.5% of all Corporate Income Tax assessed.
Sectorally, the Financial Intermediation, Insurance, Real Estate, and Business Services sector accounted for 266,262 companies (22.8% of assessed companies) and was liable for 32.8% of CIT assessed, contributing the most among all sectors.
GDP Contributions: The Real Economic Drivers
Services Sector Dominance
In 2023, services contributed 62.61% of South Africa’s GDP, while industry contributed 24.62% and agriculture just 2.62%. This service-heavy economy reflects South Africa’s evolution from its mining and agricultural roots toward a more modern, diversified structure.
Within services, finance, real estate, and business services led 2024’s annual GDP growth, contributing 0.8 percentage points through 3.5% growth. This sector’s consistent performance makes it the economy’s most reliable engine.
Manufacturing’s Struggle
Manufacturing contributes 13% of South Africa’s GDP, employing approximately 1.4 million people. However, the sector faces significant headwinds including load shedding (though this has improved recently), global competition, and infrastructure challenges. Despite these obstacles, manufacturing’s nominal GDP is forecast to grow at an average rate of 5.7% per annum over the next decade, offering hope for job creation.
The automotive industry alone accounts for about 10% of manufacturing exports and contributes 7.5% to GDP, employing around 36,000 people directly.
Agriculture’s Outsized Impact
While agriculture contributes only 2.8% to GDP and roughly 6% to total employment, the sector punches above its weight in exports and food security. Together with food production and processing, agriculture contributes up to 7% to GDP. South Africa’s status as the world’s second-largest citrus exporter and its maize export capacity make agriculture strategically vital despite its modest GDP share.
Mining’s Decline
Mining, historically South Africa’s economic cornerstone, has seen its influence wane. Mineral and Petroleum Resources Royalty payments contracted by R5.3 billion (33.4%) from R16.0 billion to R10.6 billion in 2024/25, primarily due to declining commodity prices for platinum group metals, iron ore, and coal.
The Income Sources That Drive Tax Revenue
Income from salaries, wages, pensions, overtime, and annuities accounted for 75.5% of total taxable income. This reveals South Africa’s heavy dependence on employment income rather than investment or business income. The average tax rate paid reached 21.8% compared to 21.3% in the previous year, demonstrating the progressive nature of the tax system where higher earners pay proportionally more.
By March 2024, the Personal Income Tax register had grown to 27.1 million individuals, though only 7.6 million were expected to submit returns for the 2023 tax year. This gap reflects the reality that most registered taxpayers earn below the tax threshold or work in informal sectors.
VAT: The Indirect Tax Burden
Of the 488,118 active VAT vendors in 2023/24, 80.9% were companies and close corporations, contributing 93.2% to Domestic VAT payments while receiving 92.2% of VAT refunds. This shows how VAT, while appearing to be a consumer tax, flows primarily through formal business channels.
VAT revenue in 2024/25 benefited from improved consumer sentiment, lower interest rates, and contained inflation. Early pension fund withdrawals through the Two-Pot retirement system also boosted household consumption and VAT collections.
The True Economic Drivers
Synthesizing all the data reveals who truly drives South Africa’s economy:
By geography: Gauteng dominates with 47% of personal income tax despite being only 25% of the population. Johannesburg alone contributes more than some entire provinces.
By demographics: The 35-44 age group carries the heaviest burden, with men contributing slightly more than women overall but earning significantly more at the highest income levels.
By sector for personal tax: Finance and business services generate 45% of individual tax. Government employees form the second-largest group, creating a self-sustaining loop.
By sector for corporate tax: Just 549 large companies pay 66.5% of all corporate tax. The financial services sector dominates, followed by mining and manufacturing.
By GDP contribution: Services, particularly finance and business, drive two-thirds of economic output. Manufacturing (13%) and agriculture (2.8%) play smaller but critical roles in employment and exports.
The Sustainability Question
The concentration of South Africa’s tax burden raises critical questions about sustainability. With just 2.6% of people paying 76.2% of personal income tax, the system depends precariously on a small group. This elite cohort of taxpayers faces:
- High marginal tax rates (up to 45% on income above R1.8 million)
- Increasing compliance demands
- Limited visible returns in public services
- Brain drain incentives as skilled professionals emigrate
Meanwhile, 549 large corporations shoulder two-thirds of corporate tax liability, making the system vulnerable to corporate restructuring, profit shifting, or economic downturns in specific sectors.
Conclusion
South Africa’s tax reality is one of extreme concentration. A tiny minority of individuals and companies fund the vast majority of government operations. Gauteng, particularly Johannesburg, serves as the economic heartbeat. The finance and business services sector—both for personal and corporate tax—proves indispensable.
This structure has delivered impressive tax collections, with SARS consistently exceeding targets through improved compliance. Yet it rests on fragile foundations. Sustaining this system requires not just keeping current taxpayers compliant and resident in South Africa, but dramatically expanding the tax base by creating formal employment, growing small businesses into medium enterprises, and revitalizing struggling sectors like manufacturing and mining.
The question facing South Africa isn’t just who pays tax today, but whether the economy can broaden its base before the burden on its top contributors becomes unsustainable. The answer will determine the country’s fiscal future.
Be First to Comment